
Project Info
- category: infographics/metrics
- client: university of california, office of the president (ucop)
- project date: 2019
- recommendation letter: chief of staff
UCan OPtimize your data with good visuals.
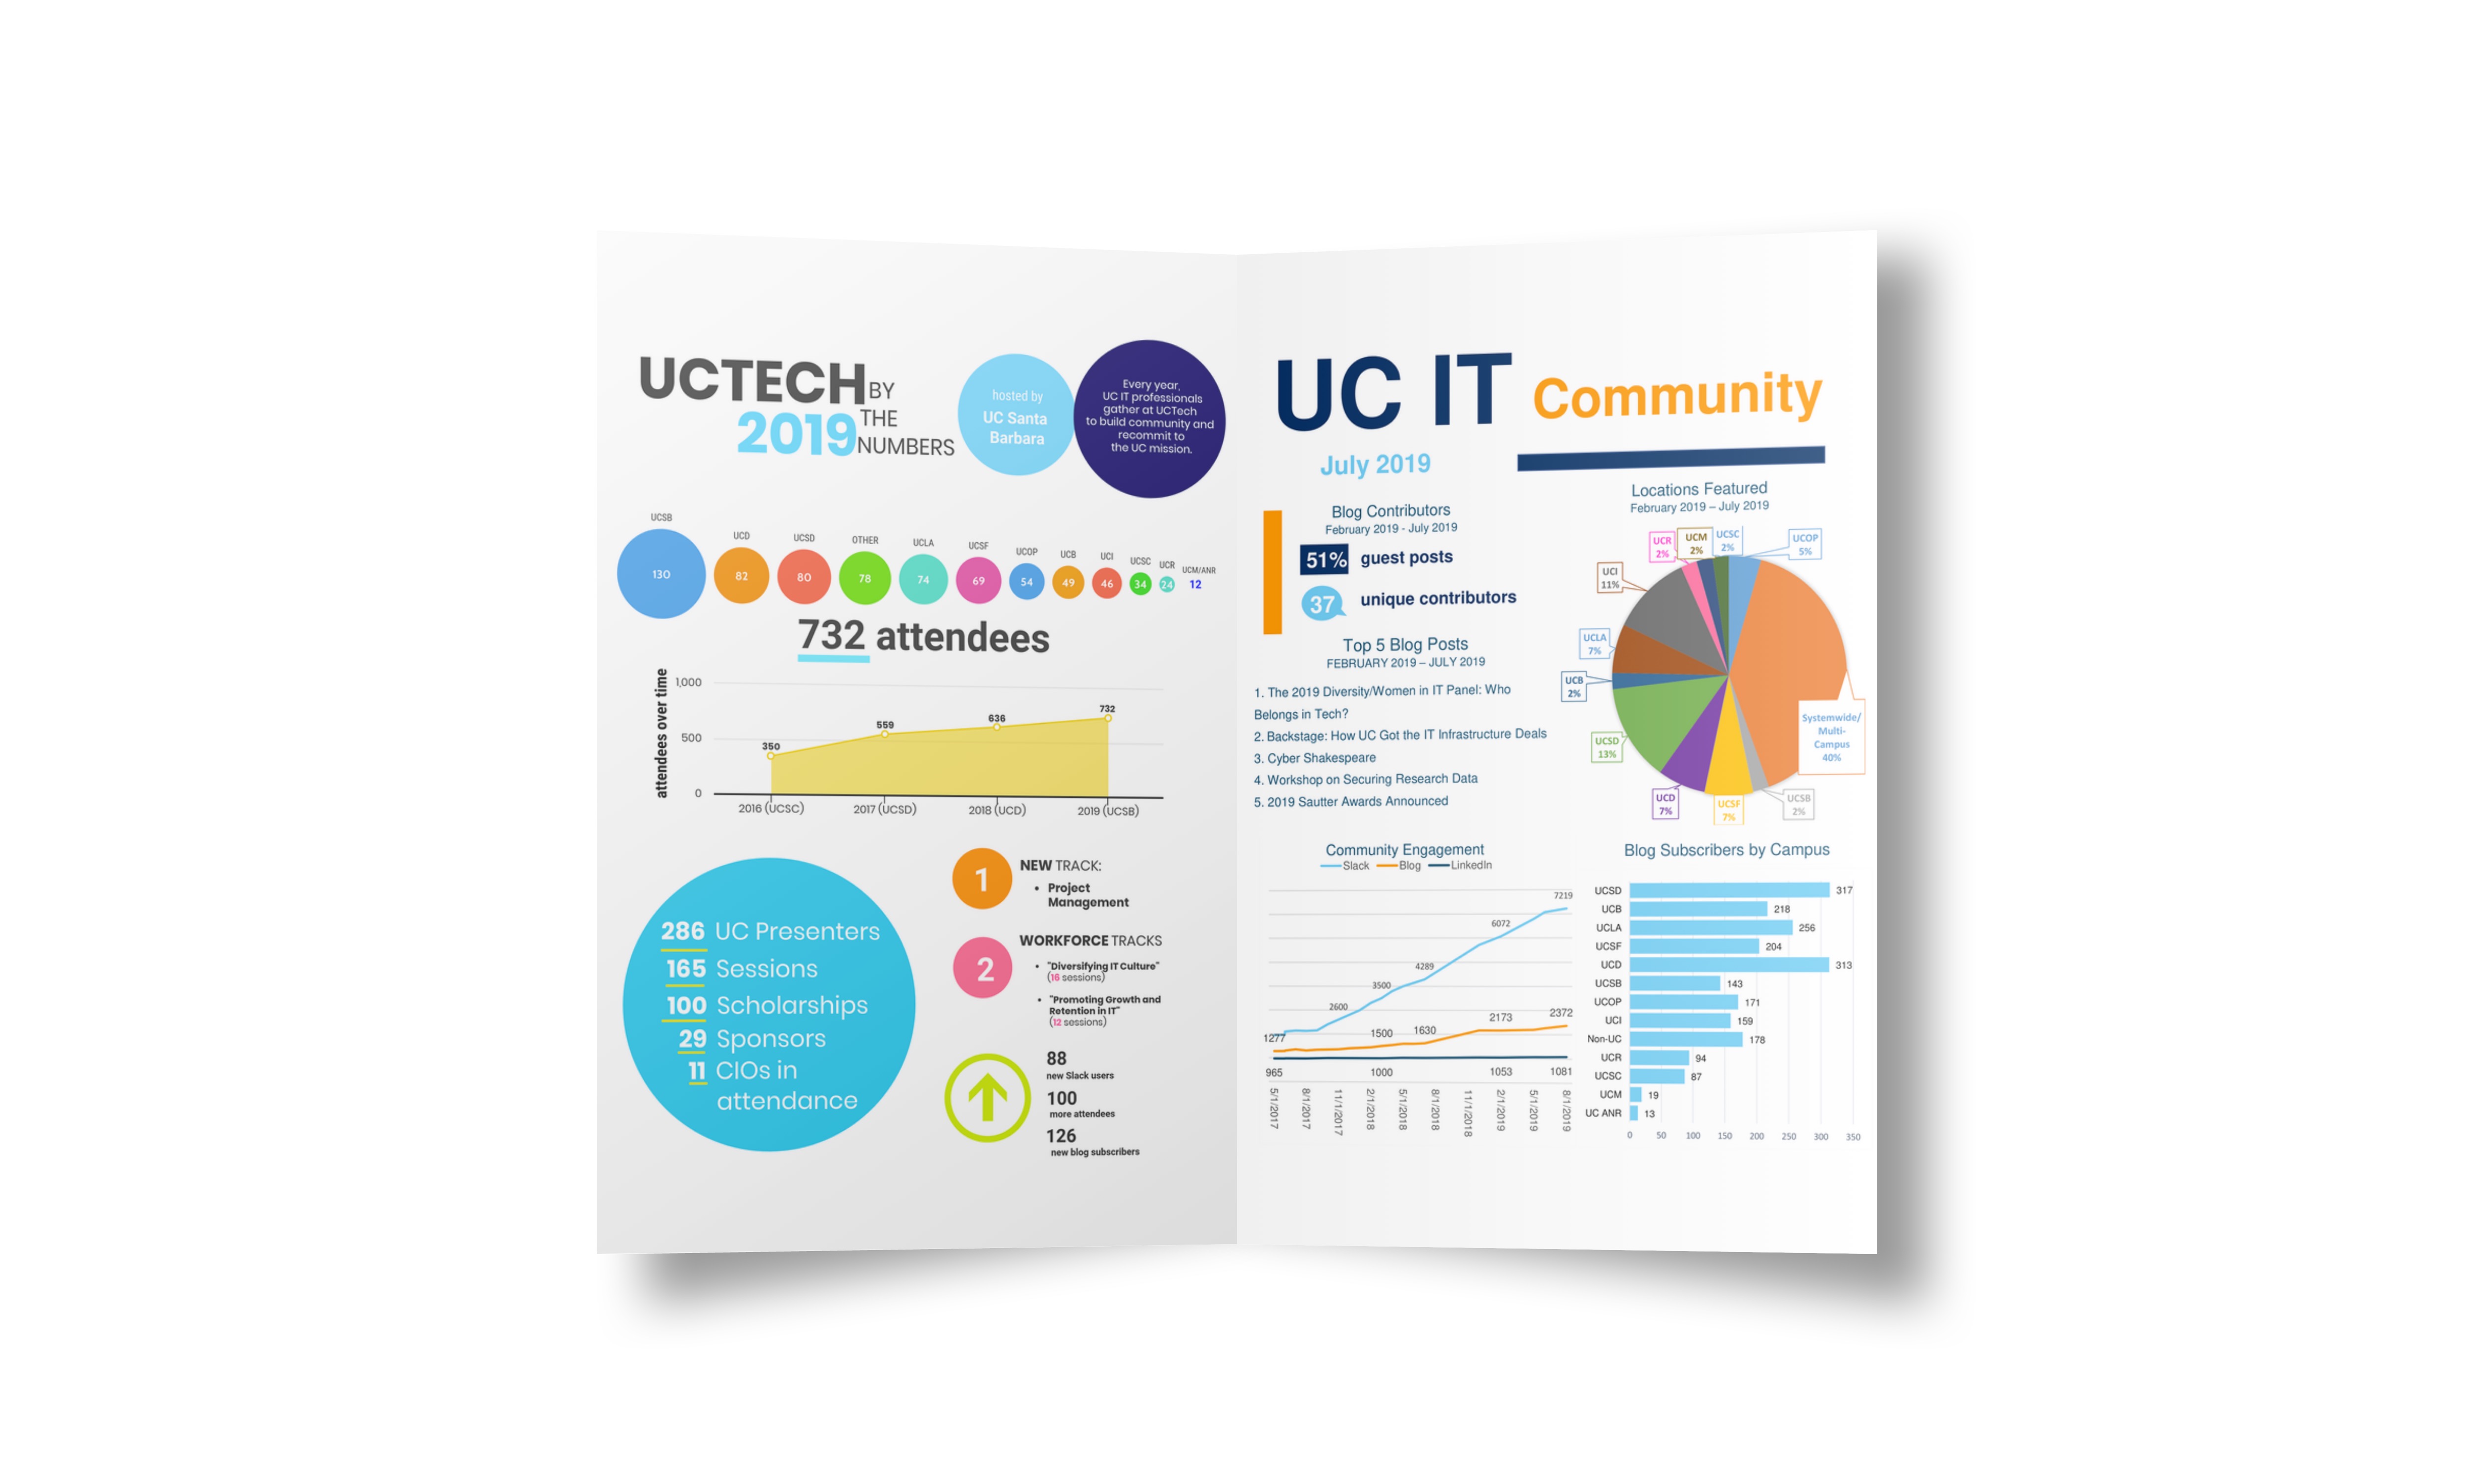
These are two data visualization projects I presented to the University of California CIO, Tom Andriola (at the time). The left showed conference stats from the annual UCTech conference. The right was a sample of the monthly metrics I produced to gauge progress on our UC IT Blog. My overall promotional efforts helped acquire 200 new subscribers to the blog at the conference.